The 30-Day Chart Literacy Plan: A Beginner's Structured Path from Crypto Holder to Informed Technical Trader
Photo: Muneorion, CC BY-SA 4.0, via Wikimedia Commons
There is a particular frustration familiar to many early crypto investors: watching a token you hold climb 40 percent over two weeks, only to give back nearly all of those gains before you think to act. Or selling during a sharp pullback that turns out to be a routine correction rather than a trend reversal. These experiences are not simply bad luck — they often reflect the absence of a framework for reading price behavior.
Technical analysis (TA) will not eliminate uncertainty from crypto trading. No methodology can. What it does provide is a structured vocabulary for interpreting market data — a way of asking better questions about what price action is communicating before you commit capital. This 30-day program is designed to take you from passive holder to chart-literate trader through incremental, daily practice.
Before You Begin: Setting Up Your Learning Environment
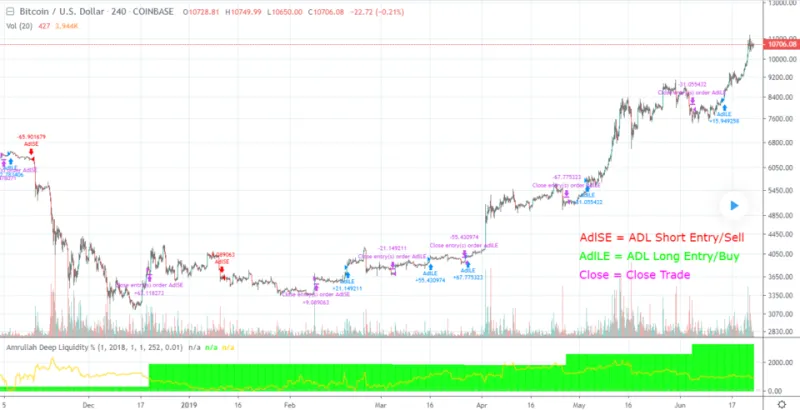
Effective technical analysis requires a charting platform. TradingView offers a free tier that is more than adequate for beginners and is widely used by professional traders. Create an account, pull up the BTC/USD pair on a daily chart, and keep this window open during your daily practice sessions. Bitcoin serves as the ideal learning instrument because its market is deep, its history is long, and patterns that appear on its chart tend to be cleaner than those on lower-liquidity altcoins.
Commit to 20 to 30 minutes of focused study per day. Consistency matters far more than session length during this phase.
Week One: The Language of Candlesticks (Days 1–7)
Day 1–2: Understanding the Candlestick Structure
Every candlestick encodes four data points: the open, close, high, and low for a given time period. A green (or white) candle means price closed higher than it opened; a red (or black) candle means the opposite. The body represents the open-to-close range; the wicks (or shadows) represent the full high-to-low range.
Spend these two days doing nothing but reading individual candles on the daily BTC chart. Ask yourself: Was this a day of strong conviction in one direction, or did buyers and sellers fight to a near-draw? Large bodies signal conviction; small bodies with long wicks signal indecision or rejection.
Day 3–4: Key Single-Candle Patterns
Focus on three patterns: the doji (open and close nearly equal, signaling indecision), the hammer (small body at the top, long lower wick, suggesting buyers absorbed selling pressure), and the shooting star (small body at the bottom, long upper wick, suggesting sellers rejected a price push higher). Identify at least five historical examples of each on your chart.
Day 5–7: Multi-Candle Patterns
Introduce the engulfing pattern (a candle whose body fully contains the prior candle's body) and the morning/evening star formations (three-candle reversal signals). Scroll back through 12 months of BTC daily data and mark every instance you can find. Note what happened in the sessions following each pattern — this builds intuition faster than any textbook.
Week Two: Trend Structure and Support/Resistance (Days 8–14)
Day 8–10: Defining Trend Structure
A market in an uptrend makes higher highs and higher lows. A downtrend makes lower highs and lower lows. A ranging market oscillates between a relatively consistent ceiling and floor. This sounds elementary, but the ability to correctly identify the prevailing trend structure on multiple timeframes is the single most important skill in technical analysis. Practice labeling the trend structure on the daily chart, then switch to the weekly chart and repeat.
Day 11–12: Drawing Support and Resistance Levels
Support is a price zone where buying interest has historically emerged; resistance is a zone where selling pressure has historically appeared. Draw horizontal lines at price levels where the market has repeatedly reversed or paused. These levels are not precise points — treat them as zones with some width. Notice how former resistance frequently becomes support after a breakout, and vice versa.
Day 13–14: Trendlines and Channels
Connect two or more significant lows with a line during an uptrend (an ascending trendline); connect two or more significant highs during a downtrend (a descending trendline). When price touches a trendline for the third time and holds, that contact point carries increased significance. Channels are formed when you can draw a parallel line on the opposite side of price action.
Week Three: Momentum Indicators (Days 15–21)
Day 15–17: Relative Strength Index (RSI)
The RSI measures the speed and magnitude of recent price changes on a scale of 0 to 100. Readings above 70 are conventionally considered overbought; readings below 30 are considered oversold. In trending crypto markets, however, RSI can remain overbought for extended periods during strong bull runs. More useful than the overbought/oversold levels is RSI divergence: when price makes a new high but RSI makes a lower high, that divergence warns of weakening momentum. Practice identifying divergences on historical BTC charts.
Day 18–19: Moving Averages
The 50-day and 200-day simple moving averages (SMAs) are widely watched by institutional participants. When the 50-day crosses above the 200-day, the formation is called a Golden Cross and is generally interpreted as a bullish signal. The inverse — the 50-day crossing below the 200-day — is called a Death Cross. Add both moving averages to your chart and observe how price has interacted with each over the past three years.
Day 20–21: MACD Basics
The Moving Average Convergence Divergence (MACD) indicator tracks the relationship between two exponential moving averages. Traders watch for crossovers between the MACD line and its signal line as potential entry or exit cues. Spend these two days simply observing how MACD crossovers have correlated with subsequent price movement on the daily BTC chart, without yet making any trading decisions based on them.
Week Four: Integrating What You Have Learned (Days 22–30)
Day 22–25: Building a Simple Confluence Framework
No single indicator is reliable in isolation. The real power of technical analysis emerges when multiple signals align — when price tests a major support level while RSI shows oversold conditions and a bullish candlestick pattern forms. This alignment of independent signals is called confluence. Spend these days scanning historical charts for moments where three or more signals coincided, and document what happened next.
Day 26–28: Paper Trading Practice
Most major exchanges and platforms offer paper trading (simulated trading with no real capital at risk). Execute at least five simulated trades based on your analysis. For each trade, write down your reasoning before entering: What is the trend structure? Where is your support or resistance reference? What is your planned exit if the trade moves against you? This discipline of pre-trade documentation is a habit that distinguishes systematic traders from impulsive ones.
Day 29–30: Review, Reflect, and Build Your Watchlist
Review every paper trade you executed. Which analyses proved accurate? Where did your reading of the chart diverge from subsequent price action, and why? Build a short watchlist of three to five assets — Bitcoin, Ethereum, and one or two others with strong liquidity — that you will follow consistently going forward. Depth of analysis on a small set of instruments is more productive than shallow monitoring of dozens.
The Road Beyond Day 30
Thirty days of structured practice will not make you an expert trader. What it will give you is a genuine foundation: the ability to read a chart with purpose, identify key structural levels, and interpret momentum signals without confusion. The next phase involves deepening your understanding of volume analysis, Fibonacci retracement levels, and multi-timeframe analysis — all of which build naturally on the skills developed here.
Markets reward preparation. The investor who has taken the time to understand what price action communicates enters each trade with a meaningful advantage over those who are simply reacting to headlines.