When Diversification Becomes a Mirage: Mapping Real Crypto Correlations Before the Next Market Shock
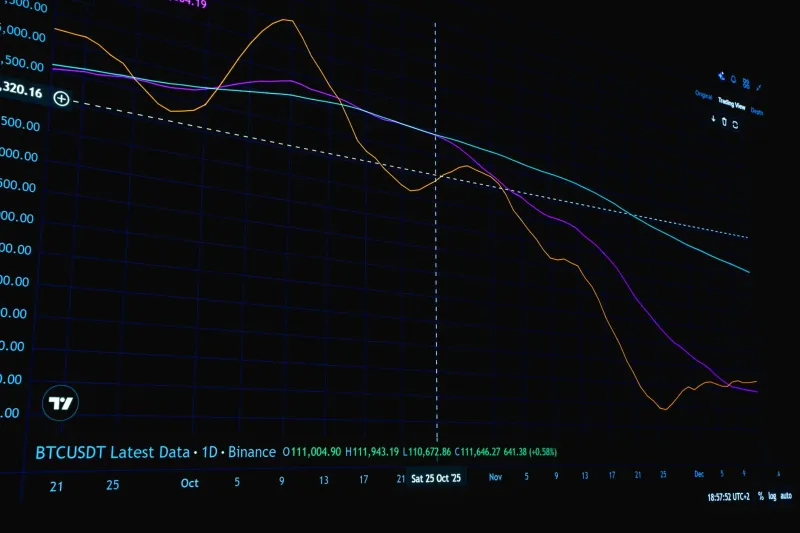
Diversification is among the most repeated principles in investment management. Hold assets that move independently, the logic goes, and losses in one position will be cushioned by stability — or gains — in another. For US crypto traders in 2025, that logic has a serious problem: the assets they are using to hedge each other frequently stop behaving independently at precisely the moment it matters most.
Understanding why requires looking past surface-level price comparisons and into the mechanics of correlation itself — how it is measured, when it breaks down, and what the data from recent bull and bear cycles actually reveals about the relationship between Bitcoin, Ethereum, and the broader digital asset market.
What Correlation Means in a Crypto Context
Correlation, expressed as a coefficient between -1 and +1, measures the degree to which two assets move together over a defined period. A coefficient near +1 suggests near-identical directional movement. A coefficient near 0 implies independence. A negative coefficient suggests inverse movement — the classic definition of a hedge.
During calm market conditions, Bitcoin and Ethereum have historically shown moderate-to-high correlation, typically ranging between 0.70 and 0.85 on a 30-day rolling basis. That figure alone should give pause to any trader treating ETH as a meaningful hedge against BTC exposure. But the more revealing number emerges during periods of acute market stress.
During the May 2021 drawdown, the March 2020 liquidity shock, and the 2022 bear market collapse triggered by the Terra/Luna implosion, Bitcoin-Ethereum correlation spiked toward 0.95 or higher. The very conditions that activated the need for a hedge were the same conditions that eliminated its effectiveness.
The Stress Correlation Problem
This phenomenon — sometimes called correlation convergence under stress — is not unique to crypto. Equity portfolio managers encountered it during the 2008 financial crisis when asset classes that had appeared uncorrelated began moving in lockstep as institutional investors liquidated everything simultaneously to meet margin calls and redemptions.
In crypto markets, the dynamic is amplified by several structural factors. First, the market is still dominated by retail participation, which means sentiment-driven selling cascades faster and more completely than in traditional asset classes. Second, the dominance of a small number of centralized exchanges means liquidity crises tend to be systemic rather than isolated. Third, the widespread use of margin and leverage means that forced liquidations can drive correlations artificially toward 1.0 as automated systems sell whatever is available regardless of fundamental value.
The practical implication is stark: a portfolio allocated 60% to Bitcoin and 40% to Ethereum may feel diversified during a bull market when the two assets occasionally diverge in short-term performance. During a macro shock or exchange-level crisis, that portfolio may behave as though it holds a single asset.
Where Independent Movement Actually Exists
Correlation is not uniformly high across all crypto pairs or all time periods. Understanding where genuine independence exists — and when — is the more productive analytical exercise.
Certain Layer-1 tokens with distinct use-case narratives have demonstrated periods of meaningful divergence from Bitcoin, particularly during ecosystem-specific catalysts such as major protocol upgrades, partnership announcements, or regulatory developments affecting a specific chain. Solana's performance during periods of Ethereum network congestion in 2021 offered one example of this dynamic.
Stablecoins, by design, maintain near-zero correlation with volatile assets — though the events of 2022 demonstrated that not all stablecoins are structurally sound enough to maintain that independence under extreme conditions.
Certain tokenized real-world asset categories and crypto-adjacent equities (such as publicly traded mining companies) have also shown lower correlation to spot BTC during specific market phases, though these relationships are inconsistent and require continuous monitoring.
Building a Stress-Test Framework
For US traders seeking to genuinely evaluate their portfolio's correlation profile, a structured stress-testing approach offers more actionable insight than static allocation percentages.
Step one involves calculating rolling 30-day and 90-day correlation coefficients for each major pair in the portfolio using historical price data. Tools such as CoinMetrics, Glassnode, and several professional-grade portfolio analytics platforms make this data accessible without requiring advanced quantitative skills.
Step two requires isolating the correlation data specifically during high-volatility periods — drawdowns of 20% or more from recent peaks, for instance — and comparing those figures to the calm-market baseline. The gap between the two numbers is the effective diversification premium the portfolio is actually delivering.
Step three involves scenario modeling: assuming that all major assets in the portfolio converge toward a correlation coefficient of 0.90 or higher, what does the portfolio's maximum drawdown look like? If that number is unacceptable, the portfolio requires structural adjustment — not simply the addition of more crypto assets, which typically share the same underlying correlation drivers.
Step four means considering genuine cross-asset diversification. For US investors, this might mean evaluating the role of Treasury instruments, commodity exposure, or equity positions in sectors with low crypto correlation as legitimate portfolio components rather than treating the crypto allocation as a self-contained diversification universe.
The 2025 Landscape
Several developments in 2025 have introduced new variables into the correlation picture. The approval and growth of spot Bitcoin ETFs has drawn a broader base of institutional capital into the market, which some analysts argue could reduce retail-driven correlation convergence over time as more sophisticated participants pursue relative-value strategies. Others contend that institutional participation increases systemic correlation by linking crypto markets more tightly to equity market risk-off behavior.
The expansion of tokenized assets and the development of crypto derivatives markets with more granular instruments also provides US traders with more tools for constructing genuinely uncorrelated positions — though utilizing those tools effectively requires a level of sophistication that most retail participants have not yet developed.
The Honest Assessment
Diversification within the crypto asset class is not meaningless. Assets do diverge in performance across extended time horizons, and tactical allocation shifts between major and minor positions can reduce volatility meaningfully during normal market conditions. The critical error is treating intra-crypto diversification as equivalent to genuine downside protection during systemic stress events.
Before the next major market shock arrives, US traders owe it to their portfolios to run the correlation numbers — not the marketing-friendly version that shows assets diverging on a quiet Tuesday, but the stress-period version that reveals how the portfolio actually behaves when conditions deteriorate rapidly. That exercise rarely produces comfortable conclusions, but it consistently produces better-prepared investors.