The Bitcoin Halving Playbook: What Four Cycles of On-Chain History Suggest About 2025–2029

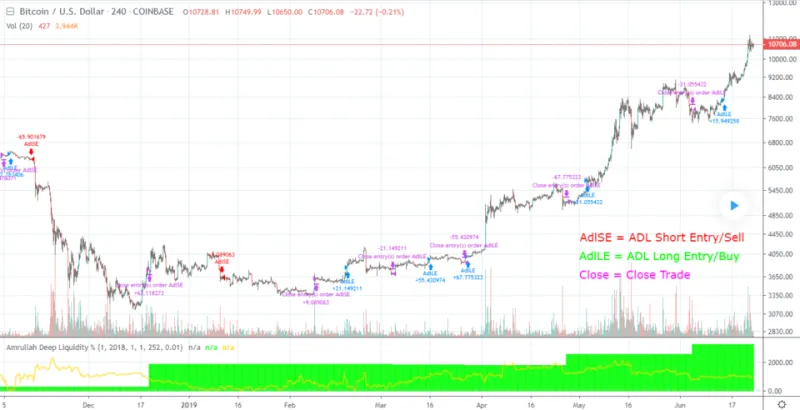
Photo: Bitcoin halving cycle chart with price history and blockchain data visualization, via 4kwallpapers.com
Every four years, Bitcoin's protocol executes a predetermined reduction in the block subsidy paid to miners — a mechanism embedded in the original design to enforce a fixed supply ceiling of 21 million coins. This event, known as the halving, has now occurred four times: in 2012, 2016, 2020, and most recently in April 2024. Each instance has been followed by a period of significant market activity that has shaped how both retail participants and institutional allocators think about Bitcoin's long-term value trajectory.
The analytical challenge is separating genuine structural signal from narrative-driven coincidence. At CoinRokka, our goal is to present what the data actually shows, acknowledge where it is incomplete, and help US investors build portfolio frameworks that account for uncertainty rather than betting on a single predicted outcome.
The Supply Mechanics and Why They Matter
Bitcoin's issuance schedule is algorithmic. Approximately every 210,000 blocks — roughly four years at the current block production rate — the reward paid to miners for validating transactions is cut in half. In 2009, miners received 50 BTC per block. After the 2024 halving, that figure dropped to 3.125 BTC.
The significance of this reduction is most clearly understood through the lens of supply and demand. Miners are among the most consistent sellers of Bitcoin; they must convert block rewards to fiat currency to cover operational costs including electricity, hardware, and staffing. When the block reward halves, the daily volume of newly mined Bitcoin entering the market drops by approximately 50%. If demand remains constant or increases, that supply reduction creates upward price pressure.
After the April 2024 halving, daily new Bitcoin issuance fell from roughly 900 BTC to approximately 450 BTC. At Bitcoin's price levels in mid-2024, that represents a reduction of tens of millions of dollars in daily sell pressure from the mining sector alone.
What the Historical Record Shows
Examining the three previous halving cycles reveals a consistent — though not perfectly uniform — pattern.
The 2012 Halving: Bitcoin traded near $12 at the time of the first halving in November 2012. Over the following 12 months, the price appreciated to approximately $1,100 — a gain of roughly 9,000%. The market at this stage was nascent, with minimal institutional participation and a very small retail base.
The 2016 Halving: The second halving occurred in July 2016 with Bitcoin trading near $650. The subsequent bull cycle peaked in December 2017 near $19,800 — approximately a 30x appreciation over 17 months. This cycle drew significantly more retail attention and introduced the broader public to cryptocurrency as an asset class.
The 2020 Halving: The third halving took place in May 2020 with Bitcoin near $8,600. The cycle peaked in November 2021 near $69,000 — approximately an 8x gain over 18 months. Critically, this cycle coincided with unprecedented institutional adoption, including publicly traded companies such as MicroStrategy and Tesla adding Bitcoin to their balance sheets, and the launch of Bitcoin futures ETFs in the United States.
A clear pattern emerges: each cycle has produced a substantial post-halving bull run, followed by a prolonged bear market that has historically retraced 70–85% from cycle highs before establishing a new floor. Equally notable is that each successive cycle's percentage gain has diminished — a mathematical inevitability as Bitcoin's market capitalization grows and the marginal impact of supply reduction on price becomes proportionally smaller.
The 2024 Halving in Context
The April 2024 halving arrived in an environment meaningfully different from any prior cycle. Several structural factors distinguish this period.
First, the approval of spot Bitcoin ETFs in the United States in January 2024 created a regulated, accessible vehicle for institutional and retail investors who were previously unable or unwilling to hold Bitcoin directly. Firms including BlackRock, Fidelity, and Invesco launched products that collectively attracted billions of dollars in inflows within weeks of launch. This institutional demand channel did not exist in prior halving cycles.
Second, Bitcoin reached its previous all-time high before the halving occurred — a historical anomaly. In prior cycles, new all-time highs were typically achieved six to twelve months after the halving event. The pre-halving price discovery in early 2024 was driven largely by ETF-related demand and suggests that some portion of the anticipated post-halving price appreciation may have been front-run by institutional capital.
Third, macroeconomic conditions in the United States — including Federal Reserve interest rate policy, inflation trajectories, and the performance of risk assets broadly — will influence Bitcoin's behavior in ways that have limited historical precedent within the halving cycle framework.
Scenario Planning for 2025–2029
Given both the historical pattern and the unique characteristics of the current cycle, a responsible portfolio approach considers multiple scenarios rather than anchoring to a single price target.
Bull Case: Historical precedent and continued institutional adoption through ETF vehicles produce a cycle peak in the $150,000–$250,000 range sometime between late 2025 and mid-2026, followed by a multi-year bear market that retraces to the $50,000–$80,000 range by 2027–2028. Investors positioned before the peak benefit from appreciation; those who enter late in the cycle face extended underwater periods.
Base Case: The diminishing returns pattern continues, with the 2024–2025 cycle producing a more modest appreciation than prior cycles — perhaps a 4x–6x gain from the halving price — followed by a shallower bear market than historical norms due to institutional buying on dips through ETF structures.
Bear Case: The front-running of post-halving appreciation by ETF-driven demand in early 2024 means the cycle has already largely played out. Price action from 2025 onward is range-bound or declining, and the traditional four-year cycle framework loses predictive value as Bitcoin matures into a more conventional macro asset.
Positioning Without Predicting
For US investors building portfolios through the 2025–2029 window, the practical implication of this analysis is not a specific price target — it is a framework for staged positioning.
Dollar-cost averaging into Bitcoin across a 12–18 month window following a halving has historically produced better risk-adjusted outcomes than lump-sum entries timed to predicted peaks. Establishing a target allocation — commonly cited in the range of 1–5% of a diversified portfolio for conservative investors, with higher allocations for those with higher risk tolerance — and maintaining it through rebalancing reduces the behavioral pressure of trying to time cycle tops.
Perhaps most importantly, the historical record suggests that investors who held Bitcoin across full four-year cycles — including bear markets that lasted 12–24 months — consistently emerged with positive returns relative to their entry prices. The greatest risks have historically been taken by those who entered near cycle peaks and sold near cycle troughs, allowing short-term price action to override a long-term allocation thesis.
The halving cycle is not a guarantee. It is a historically informed framework — one that deserves serious consideration in any long-term digital asset strategy.