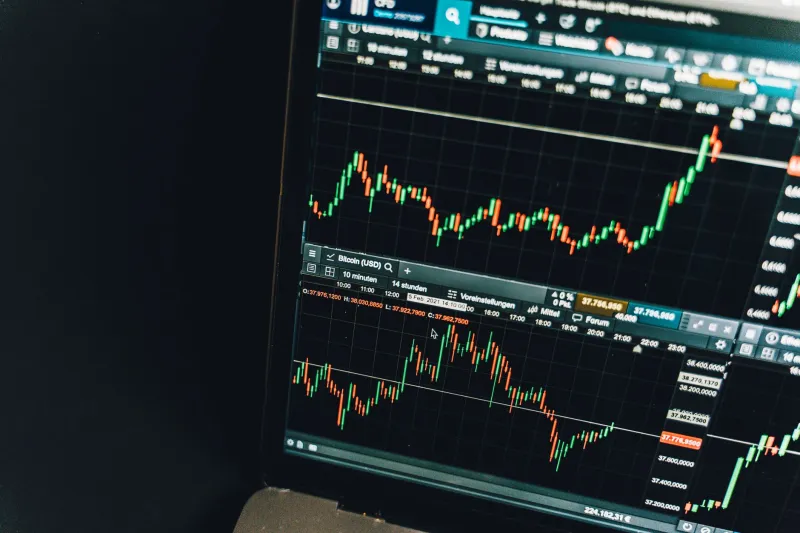
Order Flow Intelligence: The Signal Sophisticated Traders Are Reading Before Volume Even Moves

For years, trading volume was treated as the heartbeat of a cryptocurrency market. High volume meant conviction. Low volume meant indifference. That framework made intuitive sense in simpler markets, but in 2025, relying on aggregate volume figures alone is roughly equivalent to diagnosing a patient's health by counting how many times they blinked. The number tells you something, but it omits almost everything that matters.
The traders consistently extracting an edge from digital asset markets have moved on. Their focus has shifted to order flow analytics—the granular, real-time examination of how buy and sell orders actually interact at the exchange level. Understanding why this matters, and how to apply it, is no longer optional for anyone serious about navigating crypto markets in the current environment.
Why Aggregate Volume Became a Compromised Signal
The problem with reported exchange volume is both structural and behavioral. On the structural side, a significant portion of what gets counted as "volume" on many platforms is generated by market makers, high-frequency trading algorithms, and wash trading operations that cycle assets back and forth without representing genuine directional intent. Regulatory actions from the SEC and CFTC in recent years have exposed just how pervasive inflated volume reporting has been across certain exchanges—a concern that has become more acute as US regulators push for greater transparency from platforms operating domestically.
On the behavioral side, large institutional participants have become exceptionally skilled at disguising their accumulation activity. A fund building a substantial Bitcoin or Ethereum position doesn't submit a single massive market order. Instead, it deploys execution algorithms—TWAP (time-weighted average price) and VWAP (volume-weighted average price) strategies, among others—that break large orders into hundreds or thousands of smaller transactions distributed across time and across exchanges. The result is that the aggregate volume chart barely flinches while a significant position change is underway beneath the surface.
This is the liquidity illusion: markets can appear active while the actual depth of executable orders at any given price level is far shallower than the headline numbers suggest.
What Order Flow Data Actually Reveals
Order flow analysis operates at a level of granularity that aggregate volume cannot reach. Rather than asking "how much was traded today," order flow asks: who initiated each transaction, at what price, and in what sequence?
The core tool here is the time-and-sales tape—sometimes called the ticker tape—which logs every executed transaction in chronological order, including whether the aggressor was a buyer or seller. When you layer this data against the live order book, patterns emerge that volume charts simply cannot produce.
Three specific signals are worth understanding:
1. Absorption at Key Levels When large sell orders repeatedly appear at a particular price level and are consistently absorbed without the price declining, that is evidence of a buyer with significant capital defending a position. The volume chart might show ordinary activity. The tape tells a different story.
2. Bid-Stack Stacking Institutional accumulation frequently involves the quiet placement of large limit orders deep in the bid side of the order book, well below the current market price. These orders don't show up as volume until they're filled. Traders monitoring order book depth over time—rather than just the top few price levels—can identify when this stacking is occurring.
3. Aggressive Sweeping Behavior Conversely, when a buyer begins lifting offers aggressively across multiple price levels in rapid succession, clearing out available supply, that urgency is a meaningful signal. It suggests a participant who is willing to pay a premium to accumulate quickly—often because they expect an imminent price move that makes the current price, even at a slight premium, a bargain.
The Gap Between Reported Liquidity and Executable Liquidity
One of the most consequential misunderstandings among retail traders is the assumption that a deep order book represents deep liquidity. It frequently does not.
Spoofing—the practice of placing large orders with no intention of executing them, purely to create a false impression of supply or demand—remains a persistent problem in crypto markets despite increased regulatory attention. A wall of sell orders at $70,000 Bitcoin might evaporate the moment price approaches it, having served its purpose of discouraging buyers from pushing higher. The order book showed depth; the executable liquidity was never there.
This is why experienced traders supplement order book observation with trade-through analysis: tracking instances where price moves through apparent support or resistance levels that should have held based on visible order book depth. Repeated trade-throughs at levels that looked defended are a strong indicator that the displayed liquidity was manufactured.
For US-based traders using regulated domestic platforms, this issue is somewhat mitigated by exchange surveillance requirements—but not eliminated. Even on compliant platforms, algorithmic strategies operate within the rules while still creating noise that obscures genuine order flow.
Practical Tools and Methods for US Traders
Accessing meaningful order flow data has become more feasible for retail participants, though it still requires deliberate effort.
Footprint Charts are among the most accessible starting points. Available through platforms like Bookmap, Sierra Chart, and certain TradingView integrations, footprint charts display volume traded at each price level within a candlestick, broken down by buyer-initiated versus seller-initiated transactions. This allows traders to see, within a single candle, where buying pressure was concentrated and where selling was absorbed.
Cumulative Delta is another widely used metric. It tracks the running difference between buyer-initiated and seller-initiated volume over a session. A rising price accompanied by falling cumulative delta—meaning sellers are actually outpacing buyers despite the upward move—is a classic warning sign of a weak rally susceptible to reversal.
Heatmap Tools like Bookmap's liquidity heatmap visualize order book depth over time, allowing traders to observe how large orders appear, shift, or disappear as price approaches them. This is particularly useful for identifying spoofed orders versus genuine resting liquidity.
For traders who prefer not to invest in specialized software, even free tools can provide a starting point. Monitoring the time-and-sales feed on Coinbase Advanced Trade or Kraken during periods of price consolidation—watching for large lot sizes appearing consistently on the buy side while price holds steady—requires no additional subscription.
Regulatory Scrutiny Is Making This More Important, Not Less
As the regulatory environment around US crypto exchanges tightens through 2025, the incentive structures that permitted rampant volume inflation are changing. Exchanges seeking to maintain or obtain licenses under evolving state and federal frameworks have strong reasons to clean up their reported data. That's a net positive for market integrity.
However, the sophistication of institutional participants is not standing still. As one layer of information asymmetry closes, another opens. The traders who will consistently outperform are those who understand that the real edge in digital asset markets has never been about reading the same charts as everyone else—it has been about reading the market's actual behavior one level deeper.
Order flow intelligence is that next level. In a market where the gap between reported activity and real executable liquidity remains wide, the ability to interpret what is genuinely happening beneath the surface is among the most durable advantages available to an informed trader.
CoinRokka provides educational content for informational purposes only. Nothing in this article constitutes financial or investment advice. Trading digital assets involves substantial risk of loss.